There are currently no industry standards for graphene oxide analysis, however William Blythe Ltd has selected analytical techniques with excellent reputations amongst the graphene oxide community to characterise their material. The clear intention of the graphene oxide research at William Blythe is to carry out further analysis on their graphene oxide materials, the results of which will be added to this page over time. New additions will be communicated via the GOgraphene blog.
If you have any questions regarding the analysis shown below, or are interested in an analytical technique not shown here please get in touch.
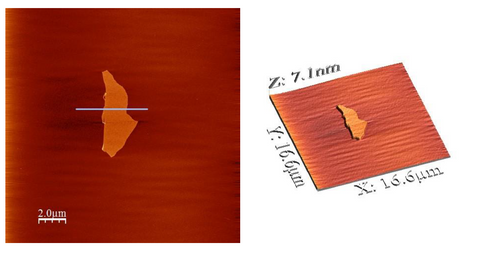
AFM (atomic force microscopy)
AFM analysis allows analysts to measure both the lateral dimensions of the graphene oxide sheets as well as the sheet depth. The sheet depth gives an indication of the number of layers of graphene oxide in each sheet.
The results shown were collected by diluting a sample of 10 mg/mL aqueous graphene oxide dispersion down to a 1 ppm dispersion.
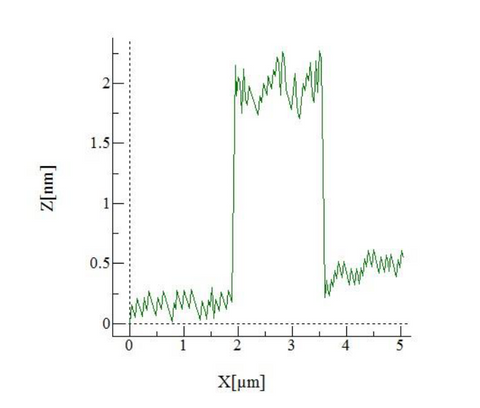
The lateral dimensions measured were variable, with most sheets showing at least one lateral dimension greater than 5 micron.
The sheet depth recorded <2 nm. For single graphene oxide sheets, the expected sheet depth is 1 nm, indicating that the graphene oxide analysed here is no more than 2 sheets tall.
ICP-OES (Inductively coupled plasma - optical emission spectroscopy)
Analysis by ICP-OES allows quantification of the trace metal impurities contained within a sample.
The graphene oxide manufactured by William Blythe has a trace metal content <0.1%.
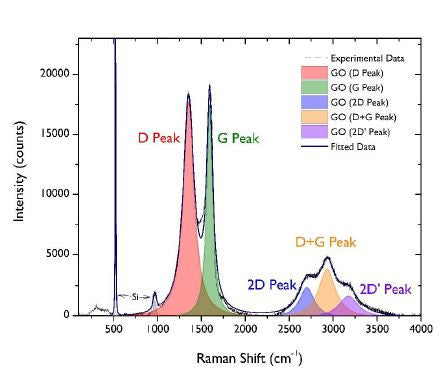
Raman Spectroscopy
Raman spectroscopy has shown that William Blythe's graphene oxide is fully oxidised with an ID/IG ratio of about 1, which is fairly typical for graphene oxide. The number of layers present has been estimated by comparing the area of the D and G peaks to the area of the silicon substrate peak (ca 950 cm-1). Coupling with an SEM image and applying false colour, it has been possible to illustrate the presence of large quantities of single layer graphene oxide. While some 2 layer and 3+ layer material is present, based on the flake shapes and the nature of spin coating, it is thought that these areas are more likely to be flake overlaps rather than multilayer graphene oxide.
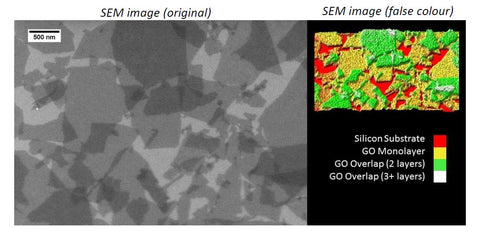
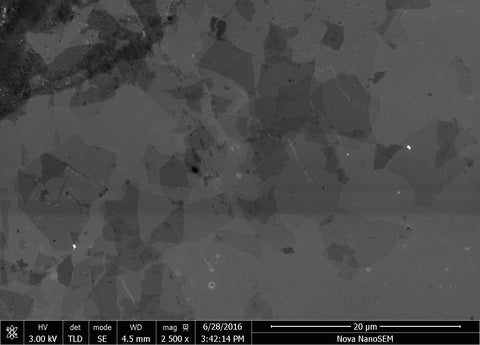
SEM (scanning electron microscopy)
SEM is carried out to examine the lateral dimensions of the graphene oxide sheets as well as observe whether there are impurities present.
The results shown below were obtained by diluting a sample of 10 mg/mL aqueous
graphene oxide dispersion to 0.00025% then oven dried on a Si wafer
SEM images, demonstrate sheet sizes with lateral dimensions of over 5 micrometers are possible in the graphene oxide products sold via the GOgraphene webshop. This is in agreement with the data obtained by AFM analysis.
Small white spots indicate the presence of a small number of metallic impurities, this has been quantified by ICP-OES and all 1% aqueous graphene oxide dispersions are supplied with a trace metal content less than 0.1%.
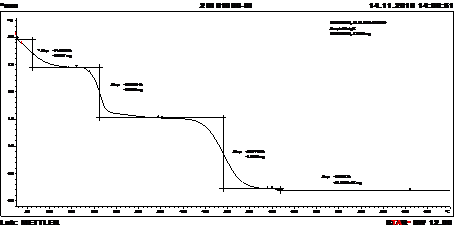
TGA (thermogravimetric analysis)
TGA is used to determine at what temperature a material decomposes. Multiple drops in mass indicate a complicated decomposition process.
The TGA above was carried out in air using
graphene oxide flake and it shows three decomposition stages. While initial decomposition takes places at low temperatures, the steeper areas of the plot at approximately 180 C and 400 C illustrate major decomposition steps. By 600 C, virtually no mass remains.
XPS (X-ray photoelectron spectroscopy)
XPS analysis is an analytical technique used to determine the surface composition of a sample.
The XPS analysis shown above was carried out on freeze dried graphene oxide powder. The oxygen and carbon peaks are then converted into a percentage, which has been used to set the current graphene oxide composition specification.
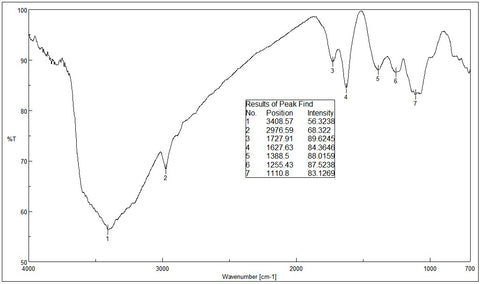
FTIR-ATR (Fourier Transform Infrared Attenuated Total Reflectance)
FTIR spectroscopy is a technique used to show the chemical bonding in a sample through the absorption of infrared radiation.
|
Wave Number
|
Possible Bond identification
|
|
3408.57
|
O-H
|
|
2976.59
|
Aliphatic C-H
|
|
1727.91
|
C=O Carboxyl vibration
|
|
1627.63
|
C=C
|
|
1388.5
|
C-O
|
|
1255.43
|
C-O
|
|
1110.8
|
C-O
|
The FTIR analysis was carried out on our freeze-dried graphene oxide powder and shows typical bonding of the groups attached to the graphene oxide sheets.
Please note that all analysis shown on this page is listed for illustrative purposes only. The results are from typical batches of graphene oxide manufactured for sale via the GOgraphene webshop, some batch to batch variation should be expected.